


At Gonzales Torres, we believe that all drunk driving crashes are preventable and that one drunk driving death is too many. We also understand that there may be vast differences in how behaviors like drunk driving affect communities. For this reason, we worked with 1Point21 Interactive to help understand where drunk driving deaths occur most often.
In this study, we analyzed 10 years of fatal crash data (from 2014 to 2023), finding that nearly 67,000 people were killed in alcohol-related crashes and one in five traffic deaths involved an impaired driver. We then examined alcohol-related fatal crash rates among cities with populations over 125,000 residents — more than 200 cities in total — to identify the 25 with the highest and lowest rates. We define alcohol-related fatal crashes as any fatal crash where at least one driver was legally intoxicated. This is noted as a blood alcohol concentration level of 0.08 grams per deciliter (g/dL) or higher.
Read on to see if your city made the lists.
Key Takeaways:
- Baton Rouge, Louisiana, had the highest annual alcohol-related fatal crash rate in the U.S. at 4.12 crashes per 100,000 residents. This is more than double the national average of 1.98.
- Cary, North Carolina, had the lowest rate with 0 alcohol-related fatal crashes during the study period.
- San Francisco, New York City, Chicago, Boston, and Raleigh were also featured among the 25 cities with the lowest alcohol-related annual fatal crash rates in the country.
How Many People Die a Day From Drunk Driving?
According to the NHTSA, 34 people are killed in drunk driving crashes on U.S. roads every single day. Despite a decades-long decline from historical highs, this fact illustrates that drunk driving remains a significant road safety issue in the United States.
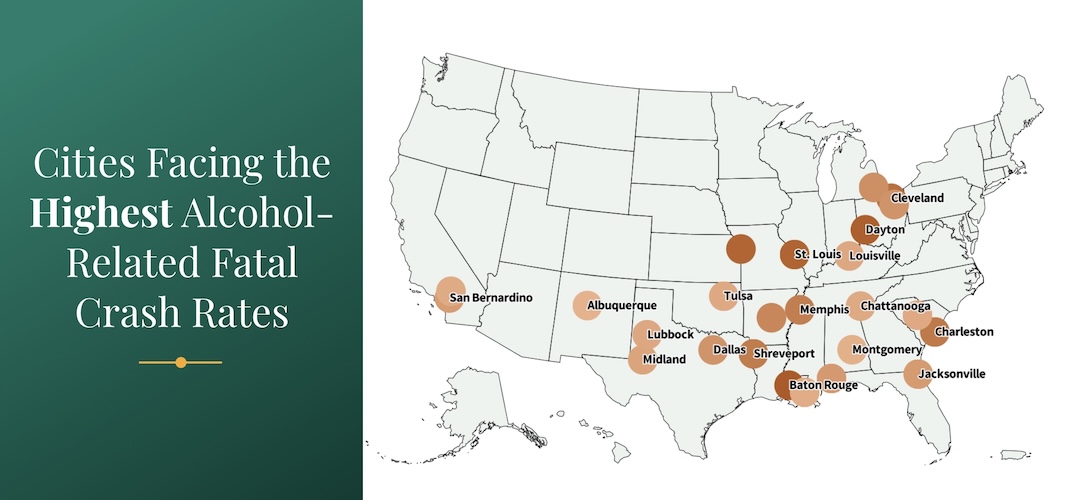
Where Alcohol-Related Fatal Crash Rates are Highest
Based on our analysis, the average annual alcohol-related fatal crash rate, where at least one driver was legally intoxicated, is 1.98 crashes per 100,000 residents. The cities below represent those with the most alcohol-related fatal crashes relative to their population size. Using ten years of national crash data, we calculated the average annual fatal crash rate per 100,000 residents for incidents where at least one driver was legally intoxicated. The table also includes the ten-year total of these incidents. The cities may also be referenced in the interactive point map below, where color intensity correlates with higher rates.
Baton Rouge, Louisiana, had the highest alcohol-related fatal crash rate during the observation period, with 4.12 crashes per 100,000 residents. Two other Louisiana cities were among the top 25: Shreveport (ranked 7th) and New Orleans (ranked 23rd). The state’s drunk driving problem has been recognized for some time, and police enforcement continues to make strong efforts to penalize and reduce these incidents.
Cities in Ohio and Missouri make up the rest of the top five, with Dayton, Ohio (ranked 2nd), St. Louis, Missouri (ranked 3rd), Kansas City, Missouri (ranked 4th), and Cleveland, Ohio (ranked 5th).
Among the largest cities in the U.S., with a population exceeding one million, only Dallas, Texas, made the list, ranking 11th with a rate of 3.01 alcohol-related fatal crashes per 100,000 residents. Compared to other major metropolitan cities in the country, Dallas has lower population density and more widely spread destinations as a result of Texas’s vast size, which increases reliance on cars for transportation. This car dependence may result in more frequent alcohol-related crashes.
Baton Rouge, Louisiana, Leads in Alcohol-Related Fatal Crash Rate
The map below represents all alcohol-related fatal crashes in Baton Rouge, Louisiana, that occurred within the study period. Hover over points for additional information.
Where Alcohol-Related Fatal Crash Rates are Lowest
The list and map below show the safest cities in our overall ranking. These are the cities with the lowest alcohol-related fatal crash rates. Additionally, the ten-year alcohol-related fatal crash total is presented. The point map below may also be referenced, with color intensity correlating with lower rates.
Contrary to common assumptions about the safety risks posed by active nightlife and higher alcohol consumption in large metropolitan areas, several of the country’s biggest cities ranked among the lowest for alcohol-related fatal crash rates. San Francisco (ranked 3rd), New York City (ranked 4th), and Chicago (ranked 23rd) recorded 0.12, 0.17, and 0.53 crashes per 100,000 residents, respectively. One factor that may help explain these results is the greater use of public transportation in these cities, which can reduce impaired driving compared to more car-dependent areas.
Other large cities such as Boston, Massachusetts, and Raleigh, North Carolina, also showed low rates. However, among all cities with populations over 125,000 residents, Cary, North Carolina, exhibited the lowest rate, with 0 alcohol-involved crashes in the ten-year span.
Please reference the table below for the full list.
Methodology
We analyzed ten years of fatal crash data from the National Highway Traffic Safety Administration’s Fatality Analysis Reporting System (FARS), focusing on crashes where at least one driver had a legally defined blood alcohol concentration (BAC) of 0.08 grams per deciliter (g/dL) or higher. Positive readings where no value is indicated were also counted. To calculate alcohol-related fatal crash rates and select our pool of cities, we used 2023 population estimates from the U.S. Census.
Fair Use Statement
If you know someone who may find this study interesting, please feel free to share it. We only ask that any publication of our findings include a link back to this study so readers can access the full results and methodology.